
Know exactly what's installed — verified against your design.
During construction, installation, or handover, we capture your entire plant using drone-based visual imaging and build a complete orthomosaic map — then compare actual installed modules and structures against your AutoCAD design to flag every discrepancy.
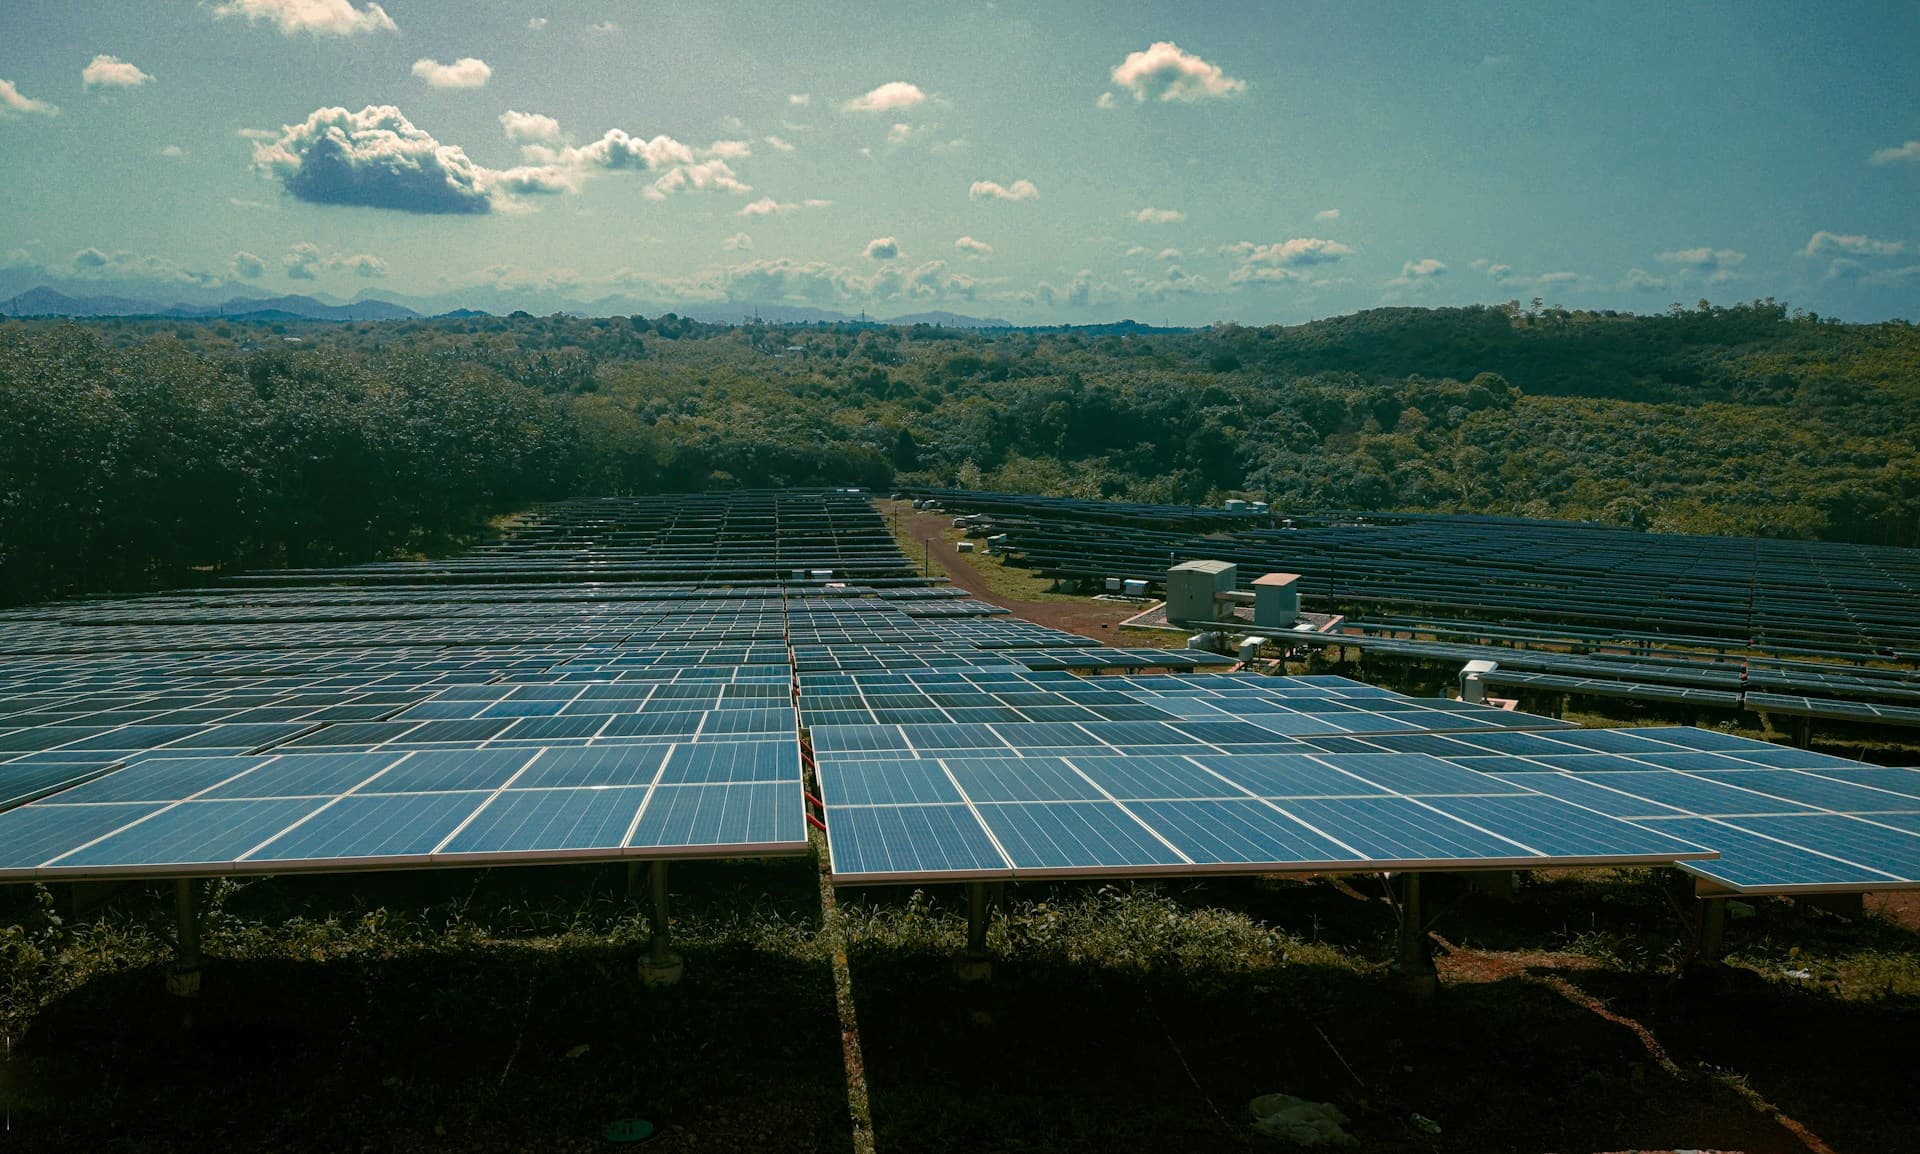
Everything we hand back, mapped and verified.
Deliverables
Complete Site Orthomosaic Map
A high-resolution, stitched aerial map of your entire plant — a single, accurate visual of the site as it actually stands today.
Module & Structure Count
An accurate count of all installed modules and structures across the site, derived directly from the captured imagery.
Structure Type Breakdown
A clear classification of how many structures of each type are installed — a complete picture of your plant's structural composition.
Block-Wise Data
Module and structure counts broken down block by block, so you know exactly what's installed in each section — not just an overall total.
Design vs. As-Built Comparison
Your AutoCAD layout is overlaid against the actual site data, so every module and structure is checked against what was planned — count, position, and placement.
Deviation Reporting
A clear report of the differences between design and reality — missing modules or structures, extra/incorrect placements, or layout deviations — so you know exactly what to address before handover.
A structured process — from first flight to final report.
Steps
Data Capture
Our drones fly the entire plant capturing high-resolution visual imagery, covering every block, table, and structure.
Orthomosaic Mapping
Captured images are stitched together into a single, accurate orthomosaic map of the complete site.
Design Overlay & Comparison
The orthomosaic is cross-referenced against your AutoCAD layout, comparing actual installed modules and structures — block by block — against the approved design.
Reporting
You receive a complete report showing total and block-wise modules and structures installed, structure type breakdown, and every deviation from the design.
One inspection — value for every stakeholder on site.
Teams served
For Owners & Developers
Get an independent, accurate verification of what's actually been installed before you sign off on handover — no relying on contractor-reported numbers alone.
For EPCs
Validate your own installation against the design before client handover, catching gaps early and avoiding disputes at the final stage.
For Asset Managers
Start operations with an accurate, verified baseline of your plant's actual module and structure count — the foundation for all future O&M and audits.
Clear outcomes your team can act on.
- 01Complete, high-resolution orthomosaic map of the entire plant
- 02Accurate installed module and structure count, block-wise
- 03Structure type classification across the site
- 04Direct comparison against your AutoCAD design
- 05Clear deviation report — missing, extra, or misplaced units
- 06An independent, verified record for handover and audit purposes
Answers before you ask.
Still have a question about structure quantification?
Get in touchMost commonly during the construction or installation phase, and especially at project handover — to verify that what's been built matches what was designed.
Verified as-built data. Before you sign off.
Get an accurate, independent count of everything installed on your site — checked against your design, block by block.